I have recently been working at a site with an Exadata, and it has several components which can be connected to with putty - compute nodes, storage nodes as well as a recovery appliance.
There is a command called 'dcli' which can be run from one host to remotely run the 'cellcli
command on the other nodes, which makes it easier to run checks without having to connect to each host.
To set it up, you will need to generate a public key on the source host if one doesn't exist. There is another post here (http://yetanotheroracledbablog.blogspot.com.au/2010/05/using-scp-without-prompting-for.html) that tells how to do that, but it's basically:
Log into the source host as root, cd to the '.ssh' directory.
Run this:
ssh-keygen -t rsa
Hit enter at every prompt.
It will create a text file called
id_rsa.pub
That contains lots of characters like this:
ssh-rsa AAAAB3NzaC1yc2EAAAABIwAAAQEA4QAwvIhn421tE51yx...NfqvWdBRUBIuNGUjhW1Rh05E2c/T7tW8pgphBX58EfceY255N4Q== root@source_host
Copy this text, log into the destination hosts as root, cd to the '.ssh' directory and there should be an 'authorized_keys' file. If not, create it.
Paste the text at the end of the file as the last entry.
You can now go back to the source host and try an 'ssh' as root. It may respond with a
"The authenticity of host.."
message, enter 'yes'. It should not prompt for the password.
Repeat for all the cells on the Exadata.
Now that you can ssh to each host without a password, you can create a text file with the names of the hosts.
Navigate to the
/opt/oracle.SupportTools/onecommand
directory
Create a text file called 'cell_group' and enter all the cell host names:
prodcell01
prodcell02
prodcell03
prodcell04
devcell01
devcell02
devcell03
devcell04
etc
You can now use the dcli command and call this file, and it will run on every cell:
dcli -g cell_group -l root "cellcli -e list CELL"
prodcell01: prodcell01 online
prodcell02: prodcell02 online
prodcell03: prodcell03 online
prodcell04: prodcell04 online
devcell01: devcell01 online
devcell02: devcell02 online
devcell03: devcell03 online
devcell04: devcell04 online
zdlracell01: zdlracell01 online
zdlracell02: zdlracell02 online
dcli -g cell_group -l root "cellcli -e LIST ALERTHISTORY WHERE endtime=null"
zdlracell02: 3 2016-10-19T17:10:16+11:00 critical "Disk controller was hung. Cell was power cycled to stop the hang."
This makes it easy to run commands across all hosts, and I also created a script to perform various checks:
#!/bin/sh
#
# Command to list all exadata cells
#
#
echo -- Checking Cells are Online
echo
dcli -g cell_group -l root "cellcli -e list CELL"
echo
echo -- Checking Cell Disk Status
echo
dcli -g cell_group -l root "cellcli -e list celldisk"
echo
echo -- Checking for Alerts
dcli -g cell_group -l root "cellcli -e list ALERTHISTORY WHERE severity = 'critical' AND examinedBy = '' DETAIL"
dcli -g cell_group -l root "cellcli -e LIST ALERTHISTORY WHERE endtime=null"
echo
echo -- No entries means there are no outstanding alerts
Sunday, October 30, 2016
Thursday, February 25, 2016
Installing statspack on an Oracle RDS on Amazon Web Services
One of our clients has advised us that they are running RDS on AWS and are having performance problems. Quite a co-incidence since my last few posts have been about creating and monitoring one of these. It just shows that it's a good idea to keep up with this stuff as much as possible.
They are running SE1, V11, so don't have AWR.
Since they don't have host access, I wondered how I could install statspack - but AWS has thought of this and there is a way to do it.
The steps are to create an Option Group with STATSPACK, then assign that group to the instance, then connect with SQLDeveloper and change the perfstat account and set up a job to run a snapshot periodically.
They also have an RDSADMIN procedure to generate the snapshot reports.
So, this is how to do it.
Sign onto the AWS console and select the 'RDS' icon.


 It will
show the ‘STATSPACK’ option
It will
show the ‘STATSPACK’ option


The report is the standard statspack report

They are running SE1, V11, so don't have AWR.
Since they don't have host access, I wondered how I could install statspack - but AWS has thought of this and there is a way to do it.
The steps are to create an Option Group with STATSPACK, then assign that group to the instance, then connect with SQLDeveloper and change the perfstat account and set up a job to run a snapshot periodically.
They also have an RDSADMIN procedure to generate the snapshot reports.
So, this is how to do it.
Sign onto the AWS console and select the 'RDS' icon.
Select
‘Option Groups’

Click on
‘Create Group’
Give the
Group a name and select the RDS type from the drop-down menus


Click on
‘Create’
Click the
box next to the new Group to select it, then click on ‘Add Option’
Use the
drop-down to select ‘statspack’ then click on ‘Yes’ next to ‘Apply Immediately’

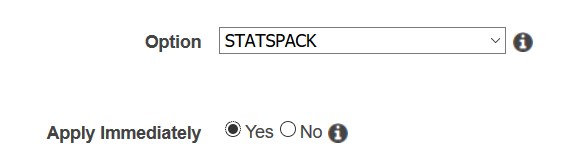
Click on
‘Add Option’

Select
‘Instances’

Click on
the box next to the instance to select it, then use the drop-down ‘Instance
Actions’ to select ‘Modify’

Scroll down
to the ‘Database Options’ section, select the new group from the drop-down,
check the ‘Apply Immediately’ box and click on ‘Continue’

At the next
page, click on ‘Modify DB Instance’
Click on
the magnifying glass icon, and the status will be shown

Click on
the ‘refresh’ icon at the top of the page after a minute or so to check on the
progress – it shouldn’t take long.

It should show
‘in sync’

You now
have to enable the perfstat account and create a job to take periodic
snapshots.
Sign in to
the instance using SQLDeveloper or SQLPlus as the master user created at RDS
set up.

Change the
password and unlock the account

Create a
new connection as the perfstat user, connect, and create the job

variable jn number;
execute dbms_job.submit(:jn,
'statspack.snap;',sysdate,'trunc(SYSDATE+1/24,''HH24'')');
commit;

Statspack
is now installed and taking a snapshot every hour.
You can
take a manual snapshot in the usual way

To generate and view a statspack report
Find the
snapids
select
snap_id, to_char(snap_time,'dd-mm-yy hh24:mi:ss') from stats$snapshot order by
1;

Run the RDS
procedure
exec RDSADMIN.RDS_RUN_SPREPORT(,); 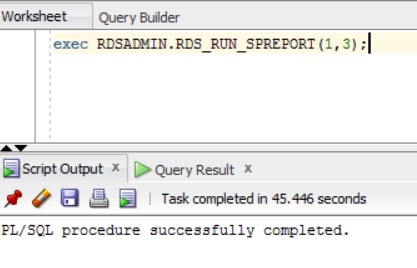
The reports
can be found under the ‘Logs’ section

The report
should be easy to find. You need to download it, the view button shows an error

Click on
the ‘Download’ button, then right-click on the link and save it

The report is the standard statspack report

So, pretty easy.

Subscribe to:
Posts (Atom)