

So this is how to do it.
This assumes that you have a table in your database that is capturing tablespace usage over time. If not, you're not going to see any data.
I have a script that captures the tablespace usage and loads it into a table to record the historical use. This is what I use, or you can roll your own.
create table tablespace_space_use
(tablespace_name varchar2(50),
used_pct number (3,0),
sample_date date default sysdate);
Then scheduled a regular job (once a week?) to generate the data:
insert into tablespace_space_use
SELECT tablespace_name,CEIL(used_percent),sysdate FROM dba_tablespace_usage_metrics;
Lets' assume this is some of the data in the table:
SYSTEM 31 15/SEP/15
SYSTEM 30 14/SEP/15
SYSTEM 29 13/SEP/15
SYSTEM 29 12/SEP/15
SYSTEM 28 11/SEP/15
SYSTEM 27 10/SEP/15
SYSTEM 26 09/SEP/15
SYSTEM 26 08/SEP/15
SYSTEM 25 07/SEP/15
SYSTEM 25 06/SEP/15
SYSTEM 24 05/SEP/15
SYSTEM 23 04/SEP/15
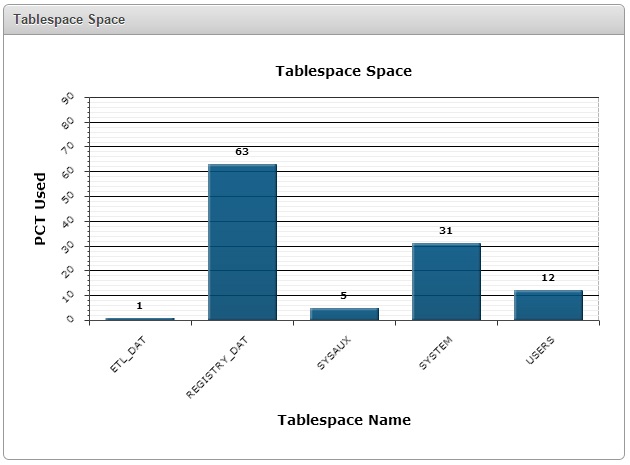
The first chart (the bar chart) only displays the most recent sample based on this SQL for the Chart Series:
SELECT null link,
tablespace_name label,
CEIL(used_percent) value
FROM tablespace_space_use
where tablespace_name not in ('TEMP','UNDOTBS','ROLLBACK','RBS','UNDOTBS1')
and sample_date=(select max(sample_date) from tablespace_space_use);
In this chart, clicking on a bar will do nothing because of the 'null link' in the SQL.
So we need to add a link to the statement, but before doing that we can create the page that we will re-direct to when the bar is selected.
So, create a new page, type chart:

Pick a line chart:


Click 'Next' at the 'TABS' page, then give the chart a name, add the names of the axes, click 'Next':

Enter the query:
select null link,
sample_date label,
used_percent value
from tablespace_space_use
where tablespace_name=:P10_TBS_NAME
order by sample_date asc
Note the P10_TBS_NAME - we'll create that shortly.
Click 'Next', then 'CREATE'.
You now have the page, but it won't work until you create the 'P10_TBS_NAME' item.
Select the '+' icon next to 'ITEMS':

Use the drop-down to select 'HIDDEN' and click 'Next':

Make sure you name it the same as in the SQL and click 'Next'

Then click 'Next' and 'Create Item'.
I always like to create a button at this stage (or 2), so do that. Select the '+' icon next to the 'Buttons' item:

Let the region default and click 'Next', then 'Next' again
Call it 'HOME' and press tab and it will fill in the same name, click 'Next':

I tend to place all my buttons at the bottom-left of the regions, but it's up to you, but I would suggest making sure that you always put them in the same place on every page.

Click 'Next'.
Use the drop-down to select what happens when the button is clicked, and select 'Redirect to Page in This Application' and select the page (my home page is page 1):


Click 'Next', then 'Create Button'.
Repeat and create a button to go back to the page that you just came from (page 3 in my case).
This page is now ready, but you need to tell it the value of the P10_TBS_NAME. You get this from the page with the bar chart (3 in my case). So go to that page and edit the bar chart SQL:
This is the existing SQL:
SELECT null link,
tablespace_name label,
CEIL(used_percent) value
FROM tablespace_space_use
where tablespace_name not in ('TEMP','UNDOTBS','ROLLBACK','RBS','UNDOTBS1')
and sample_date=(select max(sample_date) from tablespace_space_use);
And you need to change the first line to this (it is all on one line):
SELECT 'f?p='||:APP_ID ||':10:'||:APP_SESSION||'::::P10_TBS_NAME:'||tablespace_name link,
Make sure you get all the quotes, colons and || in the correct place otherwise it won't work. Note the '10' is the page name, so change that if required.
Run the page and click on the 'SYSTEM' tablespace bar (that's the one with data in this example), and you should get directed to the new page with a historical line chart.


Note that this page doesn't show the name of the tablespace that you selected - so just create a new report region with this SQL and display it where you like:
select distinct tablespace_name from tablespace_space_use where tablespace_name=:P10_TBS_NAME